Payment for order flow and market makers – Research by TradingBrokersView
What is payment for order flow?
Execution venues % of non-directed orders
[site-breadcrumb]
Main takeaways
-
TD Ameritrade and Robinhood generated the most revenue from stock PFOF in 2020-2021: $994 million and $532 million, respectively. Other brokers, like Fidelity and Vanguard, had no revenue whatsoever from stock PFOF.
-
PFOF revenue from options trading is roughly double PFOF revenue from stock trading.
-
Brokers that earn a significant amount of order flow route roughly 100% of their orders to market makers. On the other hand, brokers that earn less revenue from PFOF route proportionally more orders to public exchanges.
-
Citadel paid the most for PFOF in 2020-2021: roughly 39% of the total PFOF volume.
-
Major market makers secured $6.1 billion in net price improvement for clients and executed more than 1 trillion share trades in 2020 and 2021 combined. When COVID hit the market and around the meme stock frenzy in Q1 2021, market makers provided 40-70% more net price improvement than the average for the full 2020-2021 period. The main reason behind this is lower liquidity and higher spreads.
Global Brokerage Comparison Platform Analyzes Payment for Order Flow Trends
An independent international platform specializing in retail brokerage comparisons has evaluated over 100 brokers across global markets and currently supports more than 200,000 monthly users. Its research team continuously monitors developments and emerging patterns within the retail trading industry.
In this analysis, we examined publicly accessible data related to payment for order flow (PFOF) among retail brokers. Below is a summary of the key insights.
Contents Overview
- Key findings
- Understanding payment for order flow
- PFOF revenue by broker
- Comparative overview of brokers
- PFOF revenue by asset class
- Distribution of non-directed orders by broker
- Net price improvements among leading market makers
- Executed share volumes at major market makers
- Contact information
For additional data-driven insights and analyses, you can explore the platform’s full analytics dashboard.
Payment for order flow and market makers
What is payment for order flow?
U.S. brokers often advertise commission-free trading for retail investors, yet many generate income through a mechanism known as payment for order flow (PFOF). This practice involves brokers receiving compensation from market makers—such as Citadel or Virtu—in exchange for routing client orders to them.
It’s important for traders to understand that commission-free does not necessarily mean cost-free. Brokers that depend on PFOF typically offer less favorable price improvement, which refers to the difference between the execution price and the national best bid and offer (NBBO). This reduced price improvement can be viewed as an indirect cost, as traders might achieve better overall pricing with brokers that do not utilize PFOF.
Payment for order flow, along with broader market structure issues, is currently under review by the U.S. Securities and Exchange Commission (SEC). SEC Chair Gary Gensler has indicated that a potential ban on PFOF is being considered. If such a regulation were introduced, many commission-free brokers in the U.S. would likely need to significantly adjust their business models.
Payment for order flow and market makers
Payment for order flow data
Notes to the chart:
- Data was collected from brokers’ SEC 606 reports.
- ‘S&P 500’ denotes revenue from PFOF for stocks that are components of the S&P 500 stock index. ‘Non-S&P 500’ denotes revenue from PFOF for all other stocks.
- We used brokers’ PFOF data for the full years of 2020 and 2021.
Back to Summary
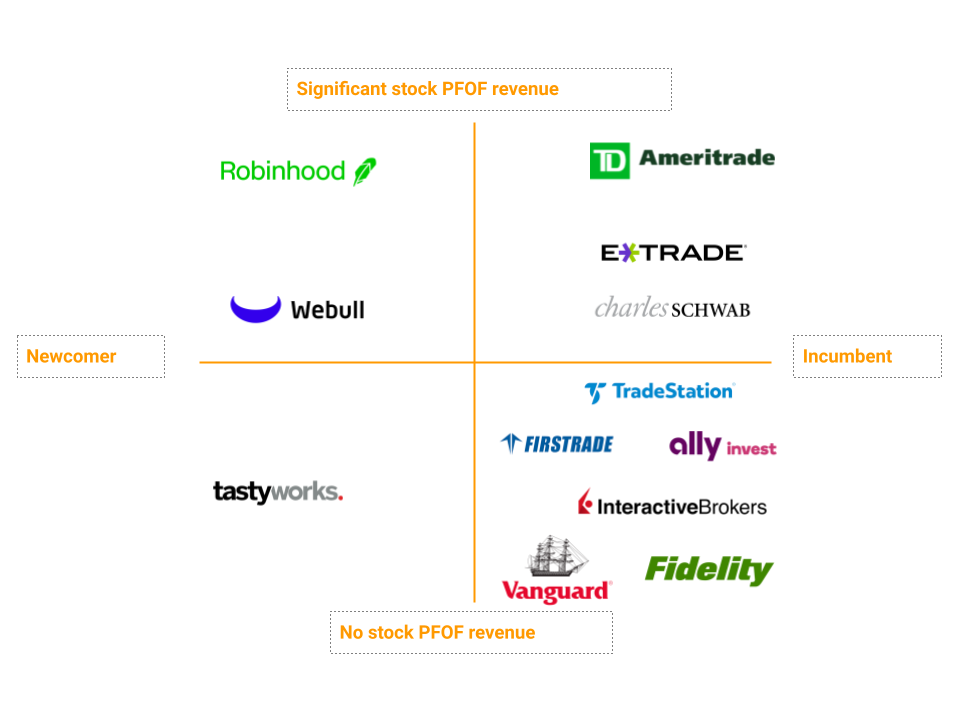
Robinhood and TD Ameritrade make the most from PFOF, while Fidelity or Vanguard don’t get any PFOF revenue
Notes to the chart:
- Data was collected from brokers’ SEC 606 reports.
- Brokers are categorized as newcomer if they were founded in the last 10 years, and incumbent if they were founded more than 10 years ago.
- We used brokers’ PFOF data for the full years of 2020 and 2021.
Back to Summary

PFOF revenue at options and stock in 2020 and 2021
Notes to the chart:
- Data was collected from brokers’ SEC 606 reports.
- S&P 500 stocks cover stocks that are components of the S&P 500 stock index. Non-S&P 500 stocks cover all other stocks.
- We used brokers’ PFOF data for the full years of 2020 and 2021.
Back to Summary
Payment for order flow and market makers
Execution venues % of non-directed orders
Notes to the chart:
- Data was collected from brokers’ SEC 606 reports.
- Percentages may not add up to 100% in some cases because the data covers only non-directed orders, i.e. when customers don’t specify the execution venue.
- We used brokers’ PFOF data for the full years of 2020 and 2021.
Back to Summary
Payment for order flow and market makers
Market maker data
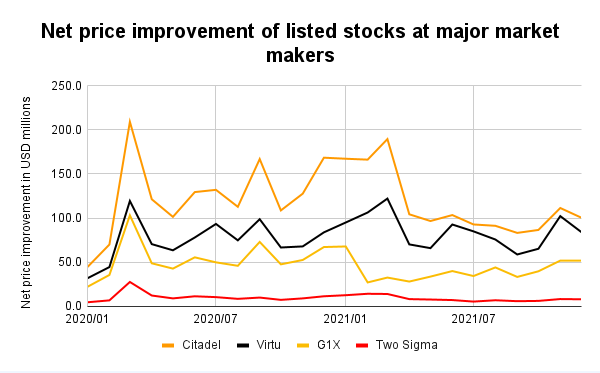
Net price improvement at major market makers
Notes to the chart:
- Data was collected from market makers’ SEC 605 reports.
- We selected Citadel, Virtu, G1X and Two Sigma, as they are the biggest market makers and most retail brokers route their retail orders to them.
- The net price improvement is the aggregate amount of the following: improved shares multiplied by the price improvement amount, minus disimproved shares multiplied by the disimprovement amount.
Back to Summary
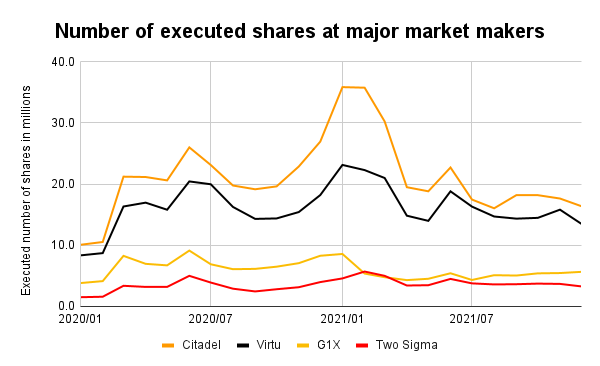
Number of executed shares at major market makers
Notes to the chart:
- Data was collected from market makers’ SEC 605 reports.
- We selected Citadel, Virtu, G1X and Two Sigma, as they are the biggest market makers and most retail brokers route their retail orders to them.
Back to Summary
Payment for order flow and market makers